


Working from dawn till dusk and wondering where the profits are? Too many trade business owners work long hours with not enough to show for it.
In addition to our Core Services, we help our trade and construction clients analyse and improve their margins, track profitability at the job level, and get more out of their business.
The formula here is clear: more profit + more time = more freedom.
If you’re a builder, small-scale developer, or running an electrical, plumbing, or similar service business, read on to learn how we can assist your business journey.
TrADEs &
construction
Who We Help.
Sole traders and contractors taking first steps
Owners with small teams seeking clarity as they grow
Established groups structuring for wealth creation


Pricing, Margins, & Profitability
For growing trade and construction businesses, pricing and margins are the biggest needle-movers, yet far too often they’re also the least actively managed. Many owners work harder, win more jobs, and grow revenue, only to find profitability doesn’t improve in line with effort. The reason is simple: margins aren’t being measured, tested, and refined consistently.
There are many different levers that affect profitability:
Pricing
Overhead Control
Asset Utilisation
Productivity
Internal Systems
Charge Out Rates
Job Mix
Supplier Terms
Labour Efficiency
Software
Pulling the right combination of these levers, in the right order, is what separates busy businesses from profitable ones.
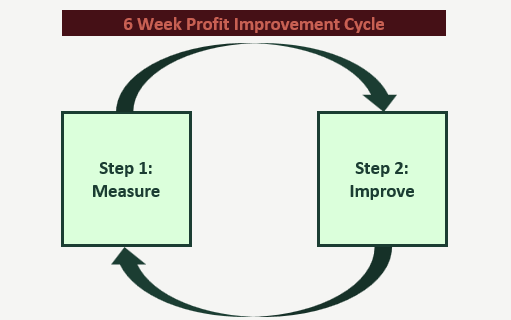
Our 6 Week Profit Improvement Cycle
Often, simple is best. We like to follow a focused, repeatable, two-step model to increase profitability: measure first, then improve.
Why six weeks? There’s no exact science, but six weeks is long enough to implement one or two small, meaningful changes (while still running the business day-to-day) and short enough to stay focused and on track. The idea is to pick one or two items, work on them deliberately for six weeks, then reset and choose the next one or two. Repeat for 12 months and you should look back on some serious progress.
The improvements themselves don’t need to be dramatic. Examples might include creating reusable quote and invoice templates, building pricing schedules, introducing pre-job checklists, recording short Loom videos to capture best practice for new staff, increasing pricing on consistently unprofitable jobs, having staff track time against jobs using software, or adjusting labour charge-out rates on certain job types. Some initiatives will be relevant, others won’t, the key is choosing the right levers at the right time.
Step one, however, is always measurement. At the centre of this is back costing. Without it, margins are assumptions. With it, they become measurable and improvable. We do tend to carry on about this, and for good reason. Measure first, then improve.
Importantly, this isn’t a framework we hand over and walk away from. This is core advisory work for us. We help you identify the right metrics, prioritise the most impactful levers, review results at the end of each cycle, and translate the numbers into clear, practical decisions. You stay focused on running the business, we help make sure each six-week cycle actually moves the needle.
What is Back Costing?
Back costing is the discipline of reviewing a job after it’s finished and comparing what you expected to make with what you actually made. It means taking the quoted price and breaking it down into the real inputs (materials, labour hours, subcontractors and other direct costs) and then measuring the true gross margin that was achieved.
It turns quoting from guesswork into a feedback loop. Instead of moving straight on to the next job, you stop briefly and ask: did this job perform the way we expected it to? Without it, you’re effectively guessing on costs and margins. With it, you begin to understand exactly how each job performed and why.
Back costing, at its core, answers questions like:
Was the labour time you assumed realistic?
Did materials cost what you expected?
Where did margins erode?
Which jobs genuinely delivered profit versus just revenue?
Is there a pricing problem, an efficiency problem, or both?
Example: Say you estimated 50 labour hours on a job, but the team actually recorded 55 hours. That five-hour overrun becomes a measurable drag on profit. Once you know where the variance occurred, you can refine future pricing, scheduling, job scope communication, or internal systems to avoid the same issue next time. Small improvements will compound over time to generate huge results.
Start small. Pick one recent job, compare estimated to actual materials and labour hours, and use that insight to inform your next quote. Over time this becomes more than a task. For high-performing trade businesses it becomes almost a religion: measure, learn, improve, repeat. The use of Job Management Software allows this process to be carried out efficiently and continually.
The most common objection is, “I don’t have time.” In reality, back costing is often the fastest way to reclaim profit without taking on more work. And importantly, you’re not expected to do this alone. We help you set the process up, review the results with you, interpret what the numbers are actually saying, and turn those insights into better pricing and decision-making going forward.
We get excited about this work because of the impact it has for our clients’ businesses and lives. Get in touch to hear more.
-
Many tradies get caught out on this early, particularly when pricing jobs quickly or copying what the bloke down the road is doing. For example, you might hear that a local electrician is charging a 35% ‘markup’ on certain jobs or materials and decide to copy that model. The issue is a simple but costly one: markup and margin are not the same thing, yet they’re often used interchangeably. Perhaps he said markup but meant margin, or perhaps he doesn’t know himself. Getting this wrong can mean you think you’re pricing profitably when in reality margins are far thinner than expected.
Markup is what you add to your costs to arrive at a selling price. Margin is the portion of the final sale price that is profit.
For example, assume a job has total costs of $1,000.
A 35% markup means you add $350, giving a selling price of $1,350. Your profit is $350, which is only a 26% margin ($350 ÷ $1,350).
A 35% margin, however, means profit must be 35% of the selling price. To achieve this, the same $1,000 job needs to be priced at approximately $1,540, generating $540 of profit. This is equivalent to a 54% markup, not 35%.
The quick way to calculate this is to divide the total costs by (1-target margin). So $1,000 ÷ (100%-35%) = $1,000 ÷ 65% = $1,540. See our Educational Resources page to dig deeper.
That gap is huge. If you price using markup when you’re targeting margin, you systematically undercharge. This is one of the most common reasons trade businesses stay busy but struggle to build real profitability. Understanding the difference is foundational, and it feeds directly into better pricing, better back costing, and better decisions as the business grows.
The market you’re operating in will obviously influence the prices you can charge, but it doesn’t always define them. The first lesson here is to understand the difference between markup and margin. We always recommend working to a target margin rather than a target markup, as this forces you to think and price in terms that actually support growth.
The second is to recognise that sometimes you need to ignore what the electrician down the road is charging and measure and improve your pricing independently. Because that bloke may also be copying his old boss – or the next guy down the street – and the math may be just as wrong. Perhaps a margin of 40% (or higher) is achievable on that particular job.
-
One of the biggest misconceptions we see in growing trade businesses is that meaningful profit improvements require massive changes – more staff, more jobs, more hours, or higher risk. In reality, some of the biggest gains come from relatively small improvements in gross margin, particularly once revenue reaches scale.
Consider a trade business turning over $2 million per year with an average gross margin of 30%. That equates to $600,000 of gross profit before overheads. Now assume that, through a combination of better pricing discipline, improved job visibility using Job Management Software (JMS), increased charge-out rates, and simply walking away from consistently unprofitable work, the business lifts its average gross margin to 35%. Revenue stays the same, but gross profit increases to $700,000.
That’s an extra $100,000 per year generated without working longer hours, winning more jobs, or taking on more risk.
These margin gains rarely come from one big change. More often they come from pulling several small levers at once: adjusting pricing on jobs that are consistently underperforming, charging for site visits and quotes, improving labour productivity, moving certain work to fixed-price service fees, or deciding not to chase low-margin work that looks busy but adds little value. JMS plays a key role here by giving you accurate job-level data so decisions are made on facts, not feel.
To put this into context at the bottom line, assume that same $2 million business is currently generating a 15% net margin after overheads. That means net profit of $300,000 per year.
If gross margin improves from 30% to 35%, gross profit increases by $100,000, from $600,000 to $700,000. In most cases, overheads (rent, vehicles, admin staff, software, insurances, etc.) do not increase materially just because margins improve. They are largely fixed or semi-fixed.
As a result, most (or all) of that additional $100,000 flows straight through to the bottom line. Net profit increases from $300,000 to $400,000, lifting the net margin from 15% to 20%.*
That’s a 33% increase in net profit, achieved without growing revenue, hiring more staff, or working longer hours. This is why we place so much emphasis on measuring margins early and improving them deliberately. Small percentage changes, applied consistently, can have an outsized impact on what you ultimately take home.
*On a larger revenue base, the numbers compound quickly. At $10 million in annual turnover, a 1% gross margin improvement delivers an extra $100,000 to the bottom line.
-
One of the most common (and costly) mistakes we see in trade businesses is underestimating the true cost of labour. Most owners look only at the hourly pay rate and build pricing around that figure. The problem is that the hourly rate is only a fraction of what an employee actually costs the business.
To illustrate this, consider a trade business employing three full-time staff.
Step 1: The Headline Hourly Rates
Assume the following base pay rates:
Dylan: $32 per hour
Lee: $44 per hour
James: $56 per hour
Step 2: Add the Labour Burden
Once you factor in on-costs, the picture changes. For each employee, the business also pays for:
Superannuation (12%)
Workers compensation insurance (assume 4.5%)
Payroll tax (where applicable)
Other direct labour costs (allowances, etc.)
These on-costs need to be added to the base hourly wage.
Step 3: Account for Non-Billable Time
Each employee may be paid for roughly 2,080 hours per year, but not all of those hours are chargeable. After allowing for annual leave, public holidays, sick leave, and an assumed 0.5 hours per day of non-billable time, billable hours fall to around 1,635 hours per employee per year.
This matters because all costs must be recovered over fewer productive hours, pushing the true cost per billable hour higher again:
Dylan total labour cost per billable hour: $47.43
Lee total labour cost per billable hour: $63.30
James total labour cost per billable hour: $83.00
It’s worth noting this assumption is relatively conservative. If non-billable time is higher, say 1 hour per day (which is common after accounting for multiple trips to suppliers, waiting around the workshop, travel inefficiencies, admin time, job setup, training, and general downtime) billable hours reduce further, and the cost that needs to be recovered per hour increases again.
That’s before a single dollar of overhead is added.
Step 4: Allocate Overheads
Now layer in overheads – vehicles, fuel, tools, rent, software, admin staff, insurance, and general running costs.
In this example:
Total annual overheads: $135,000
Total billable hours across the team: 4,905
Overhead per billable hour: $27.52
Step 5: The True Cost Per Hour
Once labour burden and overheads are included, the real cost to the business per billable hour is approximately:
Dylan: $74.95 per billable hour
Lee: $90.83 per billable hour
James: $110.52 per billable hour
After arriving at these figures, you’ll want to compare against your charge out rates.
Why This Matters
If you’re pricing labour at or near the base hourly rate (or even modestly above it) you are almost certainly undercharging. The business might stay busy, but margins will be thin, cash flow will be tight, and growth will feel harder than it should.
This is exactly why understanding the real cost of labour is foundational. Until this is measured properly, pricing decisions are guesses (and usually optimistic ones).
Only once this is clear does it make sense to move on to improving utilisation, charge-out rates, and margins.
Job Management Software
If you’re constantly putting out fires, struggling to schedule jobs effectively, or spending hours every week manually creating quotes and invoices, it might be time to implement a Job Management System.
Job Management Software (JMS), such as SimPRO or ServiceM8, enables business owners to move out of day-to-day chaos and into a more structured, scalable operation. For service-based trades like electricians, plumbers, HVAC, security, or fire management services, a well-implemented JMS is often the difference between being busy and being profitable.
At its core, a JMS connects your jobs, people, pricing, and paperwork in one place, creating the operational backbone needed to scale a business and improve margins while doing so.
Note - JMS systems work best for high-volume service businesses. Builders and others working on fewer, larger jobs will likely run on a specialised system.
Some examples of JMS functionality include:
-
Modern JMS platforms integrate directly with many Australian wholesalers and suppliers, such as Reece. This enables key efficiencies:
Connect to supplier price books so the latest pricing flows directly into quotes and purchase orders, reducing the risk of outdated costs and under-quoting.
Track and manage inventory levels within the system, place supplier orders directly through the JMS, and sync supplier invoices back to the correct job.
Allocate material costs accurately to each job, removing manual data entry, reducing errors, and improving job-level margin visibility.
-
JMS platforms improve control over your most valuable resource – time:
Schedule staff, vehicles, and equipment efficiently.
Track employee and subcontractor time against specific jobs.
Identify where labour overruns are hurting margin.
Improve accountability within your team.
-
A JMS streamlines the entire revenue cycle:
Create reusable quote templates with consistent pricing, margins, and inclusions.
Convert approved quotes directly into jobs and invoices without re-entering data.
Issue progress claims, variations, and final invoices accurately and on time.
Integrate with accounting software for faster reconciliation.
This ensures work is billed correctly and consistently.
-
One of the biggest advantages of a JMS is accurate job-level financial insight:
Track labour, materials, and subcontractors against each job in real time.
Compare quoted vs actual costs through back-costing.
Measure gross margin by job, job type, client, or crew.
Analyse revenue and profit on a per-hour basis to understand true productivity.
You can only improve what you measure. This level of detail enables is often unable to be pulled from your Xero file alone and enables meaningful profit margin improvement.
How We Help
Implementing an effective JMS is no small feat – it takes time, effort, and the vision to see past the short-term pain to the long-term benefits. We work alongside your business and your chosen JMS provider to help you:
Understand the real benefits of a JMS
Select and implement a system that actually suits your business
Get meaningful value from reporting to support pricing reviews, back-costing, and margin analysis at both the job and labour level
When set up properly, this data becomes one of the most powerful tools available for improving margins and decision-making.
If you’re considering a JMS, struggling to get value from an existing one, or want to use your data more effectively, get in touch.
Tax & Accounting Specialisation